
Using data for a narrative of the Australian innovation system
I continue to examine the current state of the Australian innovation system. The system is complex with many perspectives. Developing a single narrative can be a challenge. Thee story told by the data changes based on perspective intended outcome, time periods used, and data sources.
Thankfully, there is a growing body of work collating and presenting the information. Yesterday I briefly reviewed Innovation and Science Australia’s 2016 review, and previously considered sources including: the StartupAus Crossroads report, the federal 10-year Innovation Systems reports, the OECD body of work on innovation, the national Global Entrepreneurship Monitor survey, the digital data portal Australian Innovation Monitor, and other related productivity indexes and reports.
I feel I am coming to a relative end of this stage of thinking on the national system, or at least enough to provide an overall Australian context for my thesis on impacts of regional innovation.
To capture my views at a point in time, below is a rough table of a few of the indicators referenced in reports. This is basic Excel, mostly pulled from the Australian Innovation Monitor, and is a candidate for better visualisation in Tableau at some point in the future.
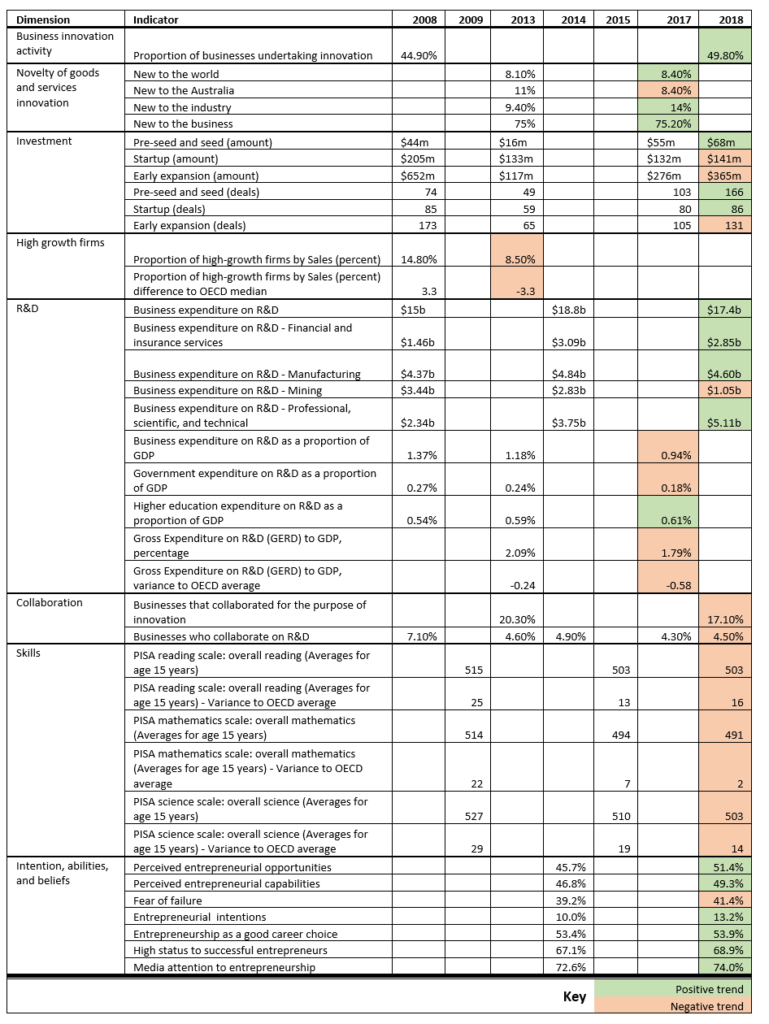
So what story is told by the data?
First, Australian businesses are innovating, but that innovation is more likely to be focused on local or industry outcomes versus national and global impact. Nearly 50 per cent of businesses undertake innovation activity. The majority of innovation activity relates to that which is new to the business (75.2 per cent) or industry (14 per cent) as compared to innovations that are new to Australia (8.4 per cent) or the world (8.4 per cent).
Second, risk funding is not always accessed or available by new ventures and those seeking new innovative initiatives. Personal savings and credit are a primary source of funding, which may contribute to the general Australian’s relatively high and increasing fear of failure when considering a new business endeavour. Venture capital finance dropped significantly from $901 million in 2008 to $575 million a decade later in 2018, although it is trending up from a 2016 low of $343 million. The total number of investments has increased in the same time period from 332 deals to 383 deals, but this is largely due to an increase in the number of lower value pre-seed and seed deals from 74 investments in 2008 to 166 investments in 2018.
Third, investment into research and development is also decreasing relative to overall GDP across business and government. Business expenditure on R&D increased from $15 billion in 2008 to $17.4 billion in 2018. This increase was due to increased contributions by the financial and insurance services sector, the manufacturing sector, and the professional, scientific, and technical sector compensating for a decrease of R&D in the mining sector from $3.44 billion to $1.05 billion. Overall business expenditure on R&D as a proportion of GDP dropped from 1.37 per cent in 2008 to 0.94 per cent in 2017. Government expenditure on R&D as a proportion of GDP also dropped during the period from 0.27 per cent to 0.18 per cent. Overall gross expenditure in R&D decreased from 2.09 per cent in 2013 to 1.79 per cent in 2017, resulting in a drop in relative position to other OECD countries from 0.24 per cent below the OECD average to 0.58 per cent below the OECD average.
Fourth, in terms of talent, there is a risk there will be a lack of future skills to develop R&D. Student scores in areas critical to new knowledge economy of reading, mathematics, and science are all on a downward trend both in actual scores as well as relative position to the OECD average. Between 2009 and 2015, Australia’s Program for International Student Assessment (PISA) scores relative to the OECD average dropped for reading by 9 points, mathematics by 23 points, and science by 15 points.
Fifth, business collaboration has also declined. Businesses that collaborated for the purpose of innovation decreased from 20.3 per cent in 2013 to 17.1 per cent in 2018. Businesses who collaborate with others on R&D decreased from 7.1 per cent in 2008 to 4.5 per cent in 2018.
Finally, the average Australian’s intentions, perceptions, and beliefs towards entrepreneurship are increasing. Between 2014 and 2018, more respondents to the national Global Entrepreneurship Monitor survey indicated that they had sufficient entrepreneur capabilities, entrepreneur opportunities, entrepreneurial intentions, attributed high status to successful entrepreneurs, saw entrepreneurship as a good career choice, and identified positive media attention to entrepreneurship (Australian Centre for Entrepreneurship research, 2015; Steffens & Omarova, 2019). There remains however an increasing fear of failure which can act as a barrier to executing on the intentions.